Neural Networks in Architecture - part 1
While artificial intelligence makes more noise and finds more applications in architecture, here are small experiments I did playing around with simple solar studies and the Owl plugin
Solar studies (simple annual solar hours or advanced dynamic simulations) can sometimes take quite some computing time… Which can become problematic for optimisations. A good practice when combining these two subjects would be to prefer the Opossum plugin as it involves some machine learning to reduce the number of iterations needed to find good solutions.
Here, on the other hand, is just a small experiment that may (hopefully) illustrate a bit better how Neural networks work and what are some of their limitations.
Solar hour prediction
The exercice here is to take a tower of which only the height, and the XY position can vary. Based on that (and only on that) predict a 20x20 solar hour heat map for 6 predefined vectors. This means that if the tower get thicker, the heat map will not change, as the neural network will not be trained with that information.
This limits a lot the possibilities, but is just for example purposes.
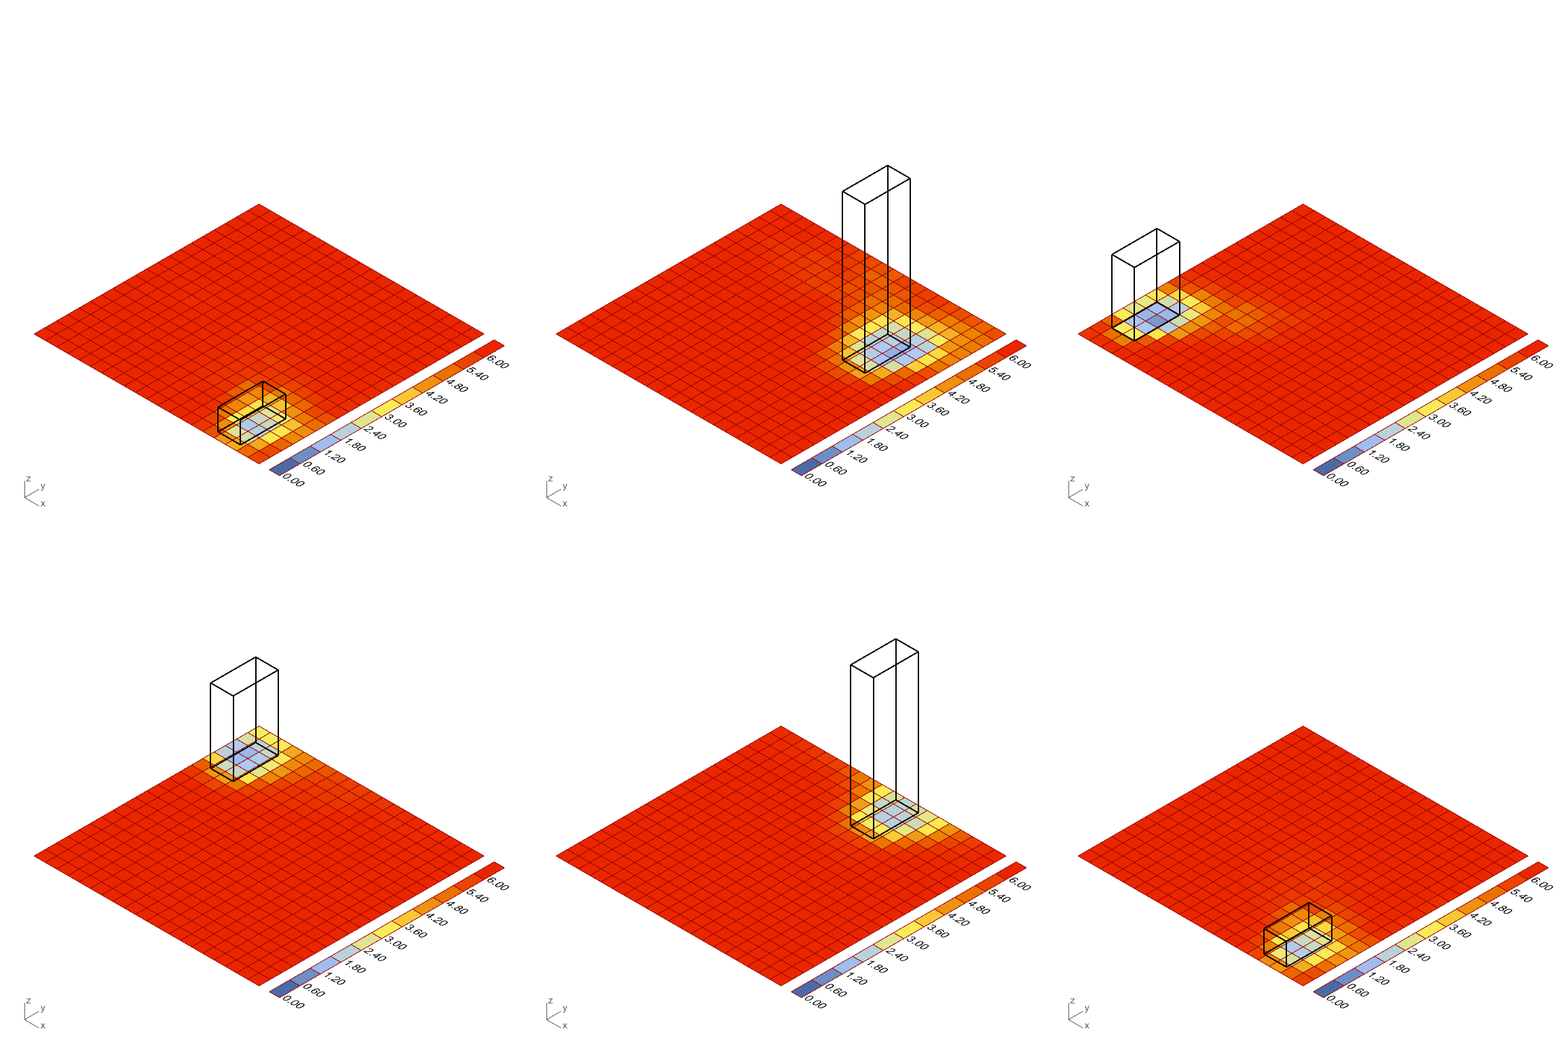
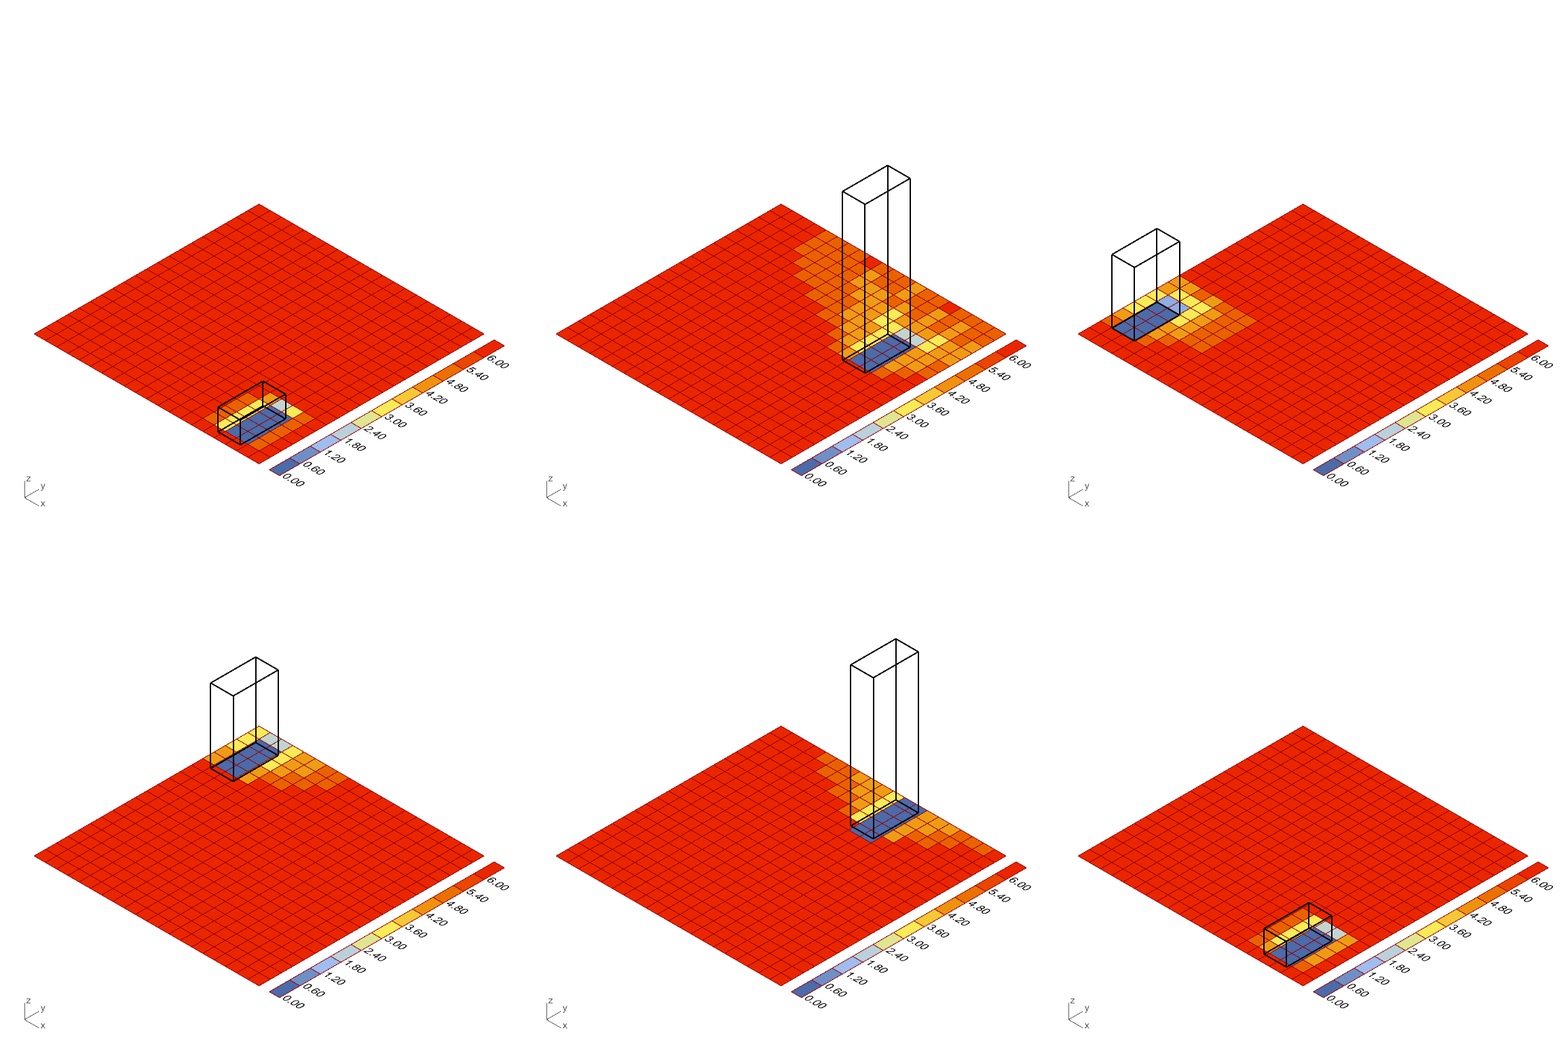
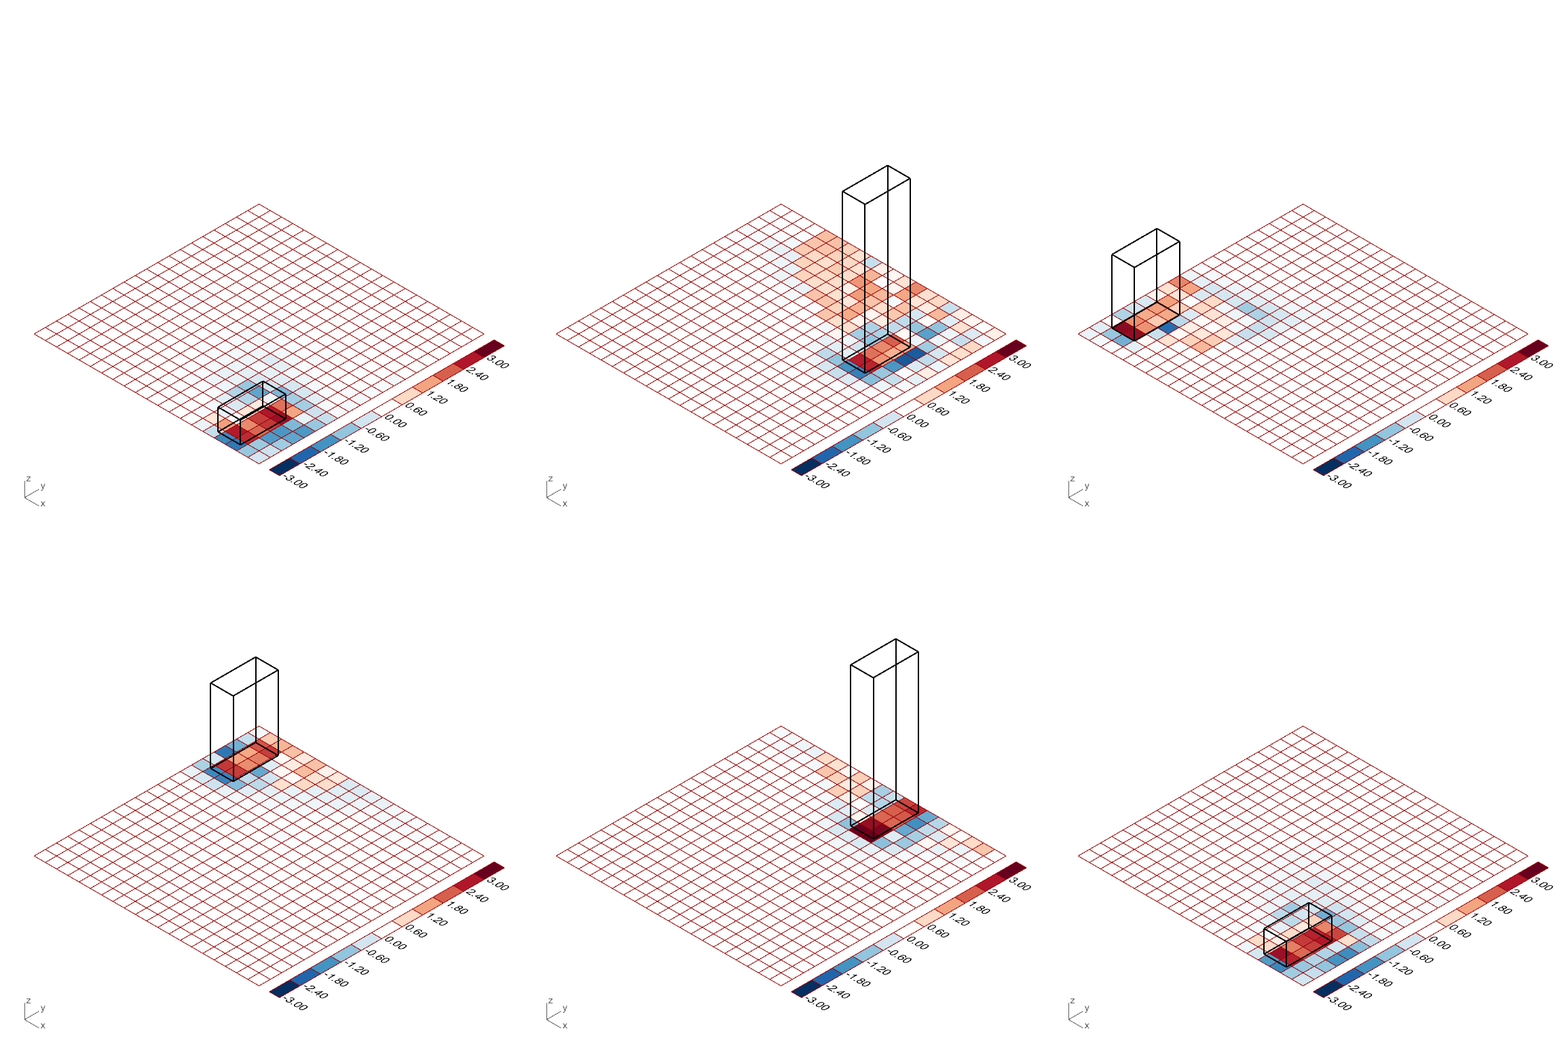
Here under 3 gifs illustrating the results of the experiment. The one on the left shows the color prediction of all individual tiles depending on the height of the tower and its XY position. In the middle, we see what is the correct answer (simply simulated with ladybug). The last one reveals the positive or negative error value for each tiles between the two results (predicted and simulated).
On a performance level, the prediction is way faster than the simulation (even if in this very example, the simulation does not take long).
The prediction results seem to be quite close to the actual solution, although the overall values seems to be blurred. The main (and more than significant error) seem to always happen under the tower, where the prediction model seem to over evaluate the number of hours (which should be 0).
Before talking about the relevance of this example, let’s very quickly showcase what going on under the hood.
To train the neural network, around 500 cases were created and simulated (see picture under). For each case, the XY position and the height of the tower is recorded as the “inputs”, and the value of each of the 400 small tiles recorded as “outputs”. To facilitate the training, all the input and output values are normalized (between 0 and 1).
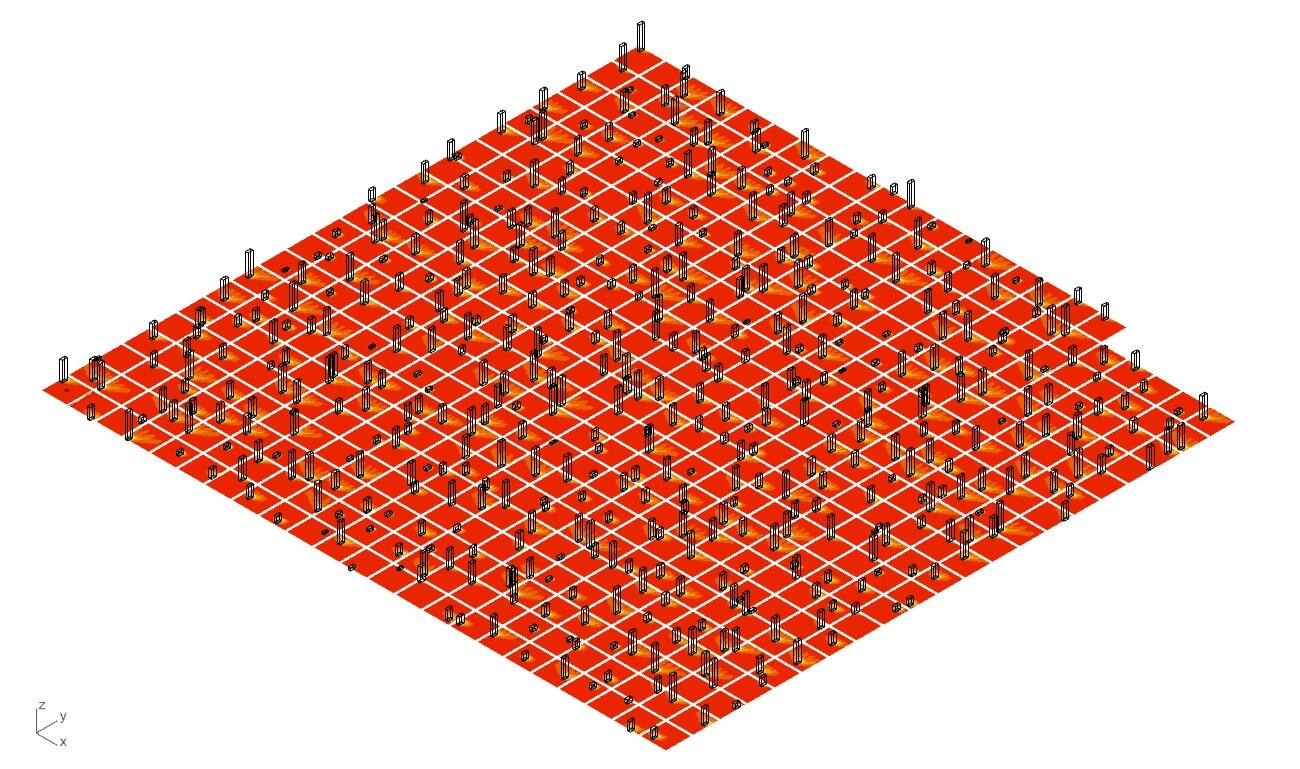
All the training dataset visualized in Grasshopper3D.
The architecture of the network is decided after some tests. There does not seem to be a general rule book that determines the complete architecture of the model.
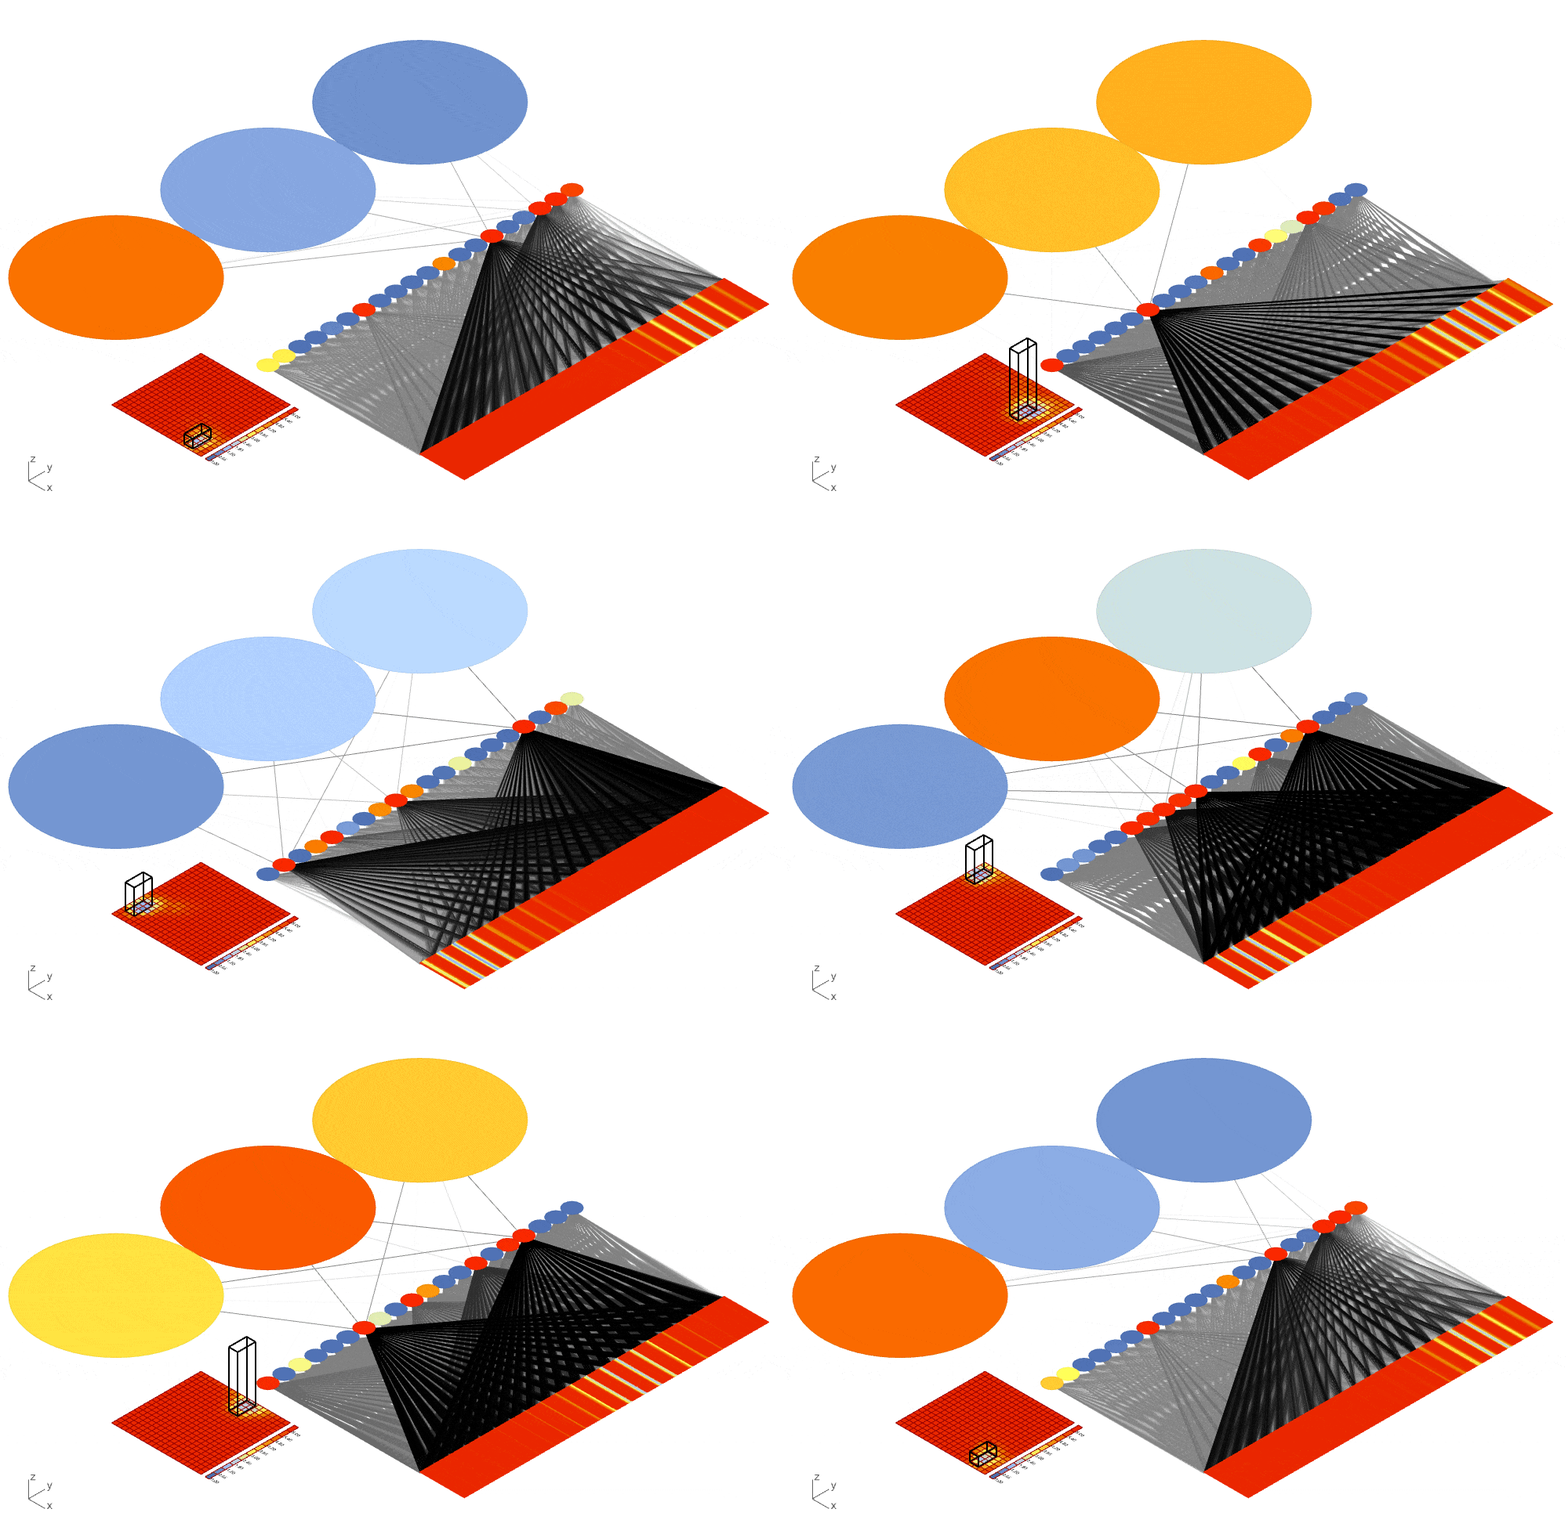
In our case, the network is (3, 20, 400). This means the first layer has 3 neurons, the middle layer has 20 neurons (arbitrary choice) and the output layer has 400 neurons.
The input layer (the 3 big dots here under) takes the height, the Y position and the X position of the tower (from top to bottom).
The middle layers (in general) are there only to allow the network to store patterns or relations between other layers. The neurons count is problem dependent and has to be tested.
The output layer is always what you are trying to predict. In this case 400 neurons for the 400 tiles of the solar heat map.
In this example, and with the Owl plugin, the automated training process takes around 4 minutes.
For anyone interested in what’s going on in a neural network, here is a cool video playlist from 3 Blue 1 Brown. If some of you are interested in learning in detail what really happens and how to code them in python from scratch, I’d recommend “Gorkking Deep Learning” or “Neural Networks from scratch in Python”.
Here under, a custom script that extract the data from a trained neural network from Owl and lay down a preview while it’s being tested. The color range in the Network goes from blue to red, which corresponds to values from 0 to 1.
The input layer (on the left) takes Height, Y coordinate, X coordinate (respectively from top to bottom in the GIF). We can see neurons fire up in the middle layer as the input values are changing, resulting in values for all of the 400 output neurons.
I don’t think any conclusions on a quick experiment like this would be relevant, although I would simply like to highlight some of the limitations this type of approach rises.
A (maybe too) well defined problem :
This very trained neural network works for a tower that has a specific X and Y dimensions, a specific orientation, a specific set of solar vectors (count and direction), and a solar heat map of exactly 20 by 20 mesh faces. If any of these specific values where to be changed, the results will be from partially to totally wrong. Simply because the neural network hasn’t trained on such values. That would require a different network.
Fast, but after how long :
A prediction may be instantaneous, the training process simply isn’t. Put into a simple perspective, with this example, 10 seconds were spent on the 500 simulations made prior to the training, and the training itself took about 4 minutes (240 seconds). From this we can assume that one simulation costs 0.02 seconds. A prediction cost about 0.001 second.
(240 sec + 10 sec) / 0.001 sec = 250 000
250 000 is the number of cases predicted after which the neural network become relevant timewise (only) for this example. As irrelevant the neural network seems after these numbers, keep in mind that using sliders in Grasshopper often creates hundreds or thousands of states. There is also a satisfying feeling of being able to have instant results of something that should take few seconds, minutes or hours !
I’d add that, as much as this model works (roughly) for a very specific task, it still is able to predict solar heat map that it hasn’t seen in its training phase (there was only 500 cases and the GIF clearly displays more). As long as your input and output data and shape is consistent (and that there is a correlation between the input and output), a neural network could find its use in a particular practice… But it’s important to note that to each problem its own neural network.
In practice, I could see obscure computational designer (or data scientists) processing data and training models for the architects and clients to be able to experiment live with instant predictions to specific but costly problems (timewise). But the more difficult part is yet to come : how to translate geometry to numbers? I’ll leave that to another post !
Antoine -

