House packing
Fitting around 150 houses on 7 lands while maintaining good views and good social distancing for each one isn’t something easy with traditional drawing tools. As soon as I heard about a project in the need of such black magic, I secretly decided to have a go at it !
Optimizing the position and orientation of 150 houses isn’t a problem one should inflict to one self
Assuming someone takes the time to draft a proposition by hand/traditional CAD methods, any modification on one (or more) house(s), would have repercussions on the placements and orientations of all the other houses (without even accounting for the time it takes to make yet the first proposition).
Optimizing the position and orientation of 150 houses isn’t a problem one should inflict to one’s computer
With traditional optimization methods (fitnesses and parameters), moving and orienting one house would require at least 3 parameters. Doing so for a 150 houses makes up for 450 parameters… Which creates a problem in 451 dimensions. Not only it will be extremely long to calculate, it is more likely that the problem will never be solvable. Not for a global optimum, but not so much for decent local optimum results either.
Exploring local optimums, fast
In a situation where the global optimum isn’t achievable, another option would be to create a tool that would allow the architects to quickly iterates through local optimums with quantitative results in order to classify the propositions.
To do so, and to avoid the optimisation problem stated above, I’ve decided to explore the potentials of a circle packing simulation, where all the houses would self arrange in their own land.
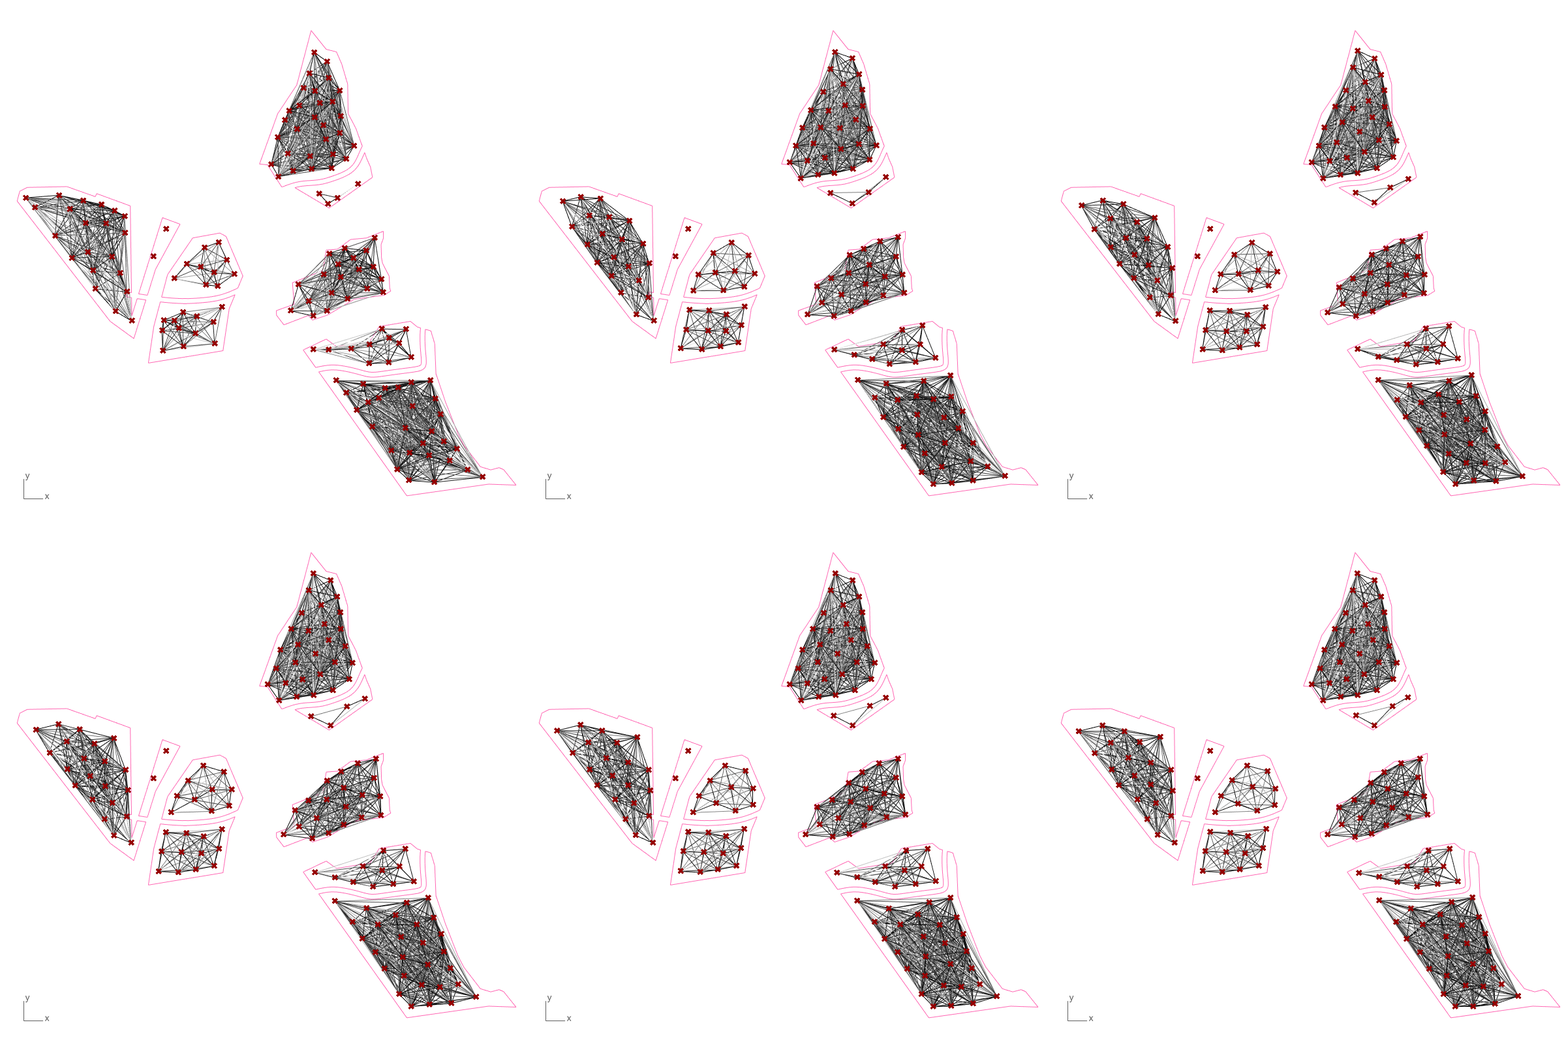
On the left, the points represent the position of the houses and the black and white lines the influences of the near by houses (the darker the stronger influence). All connections are happening inside of a land since the lands are separated by some distance; there was no need to add countless connections that would barely modify the result while increasing (quite significantly) the compute time.
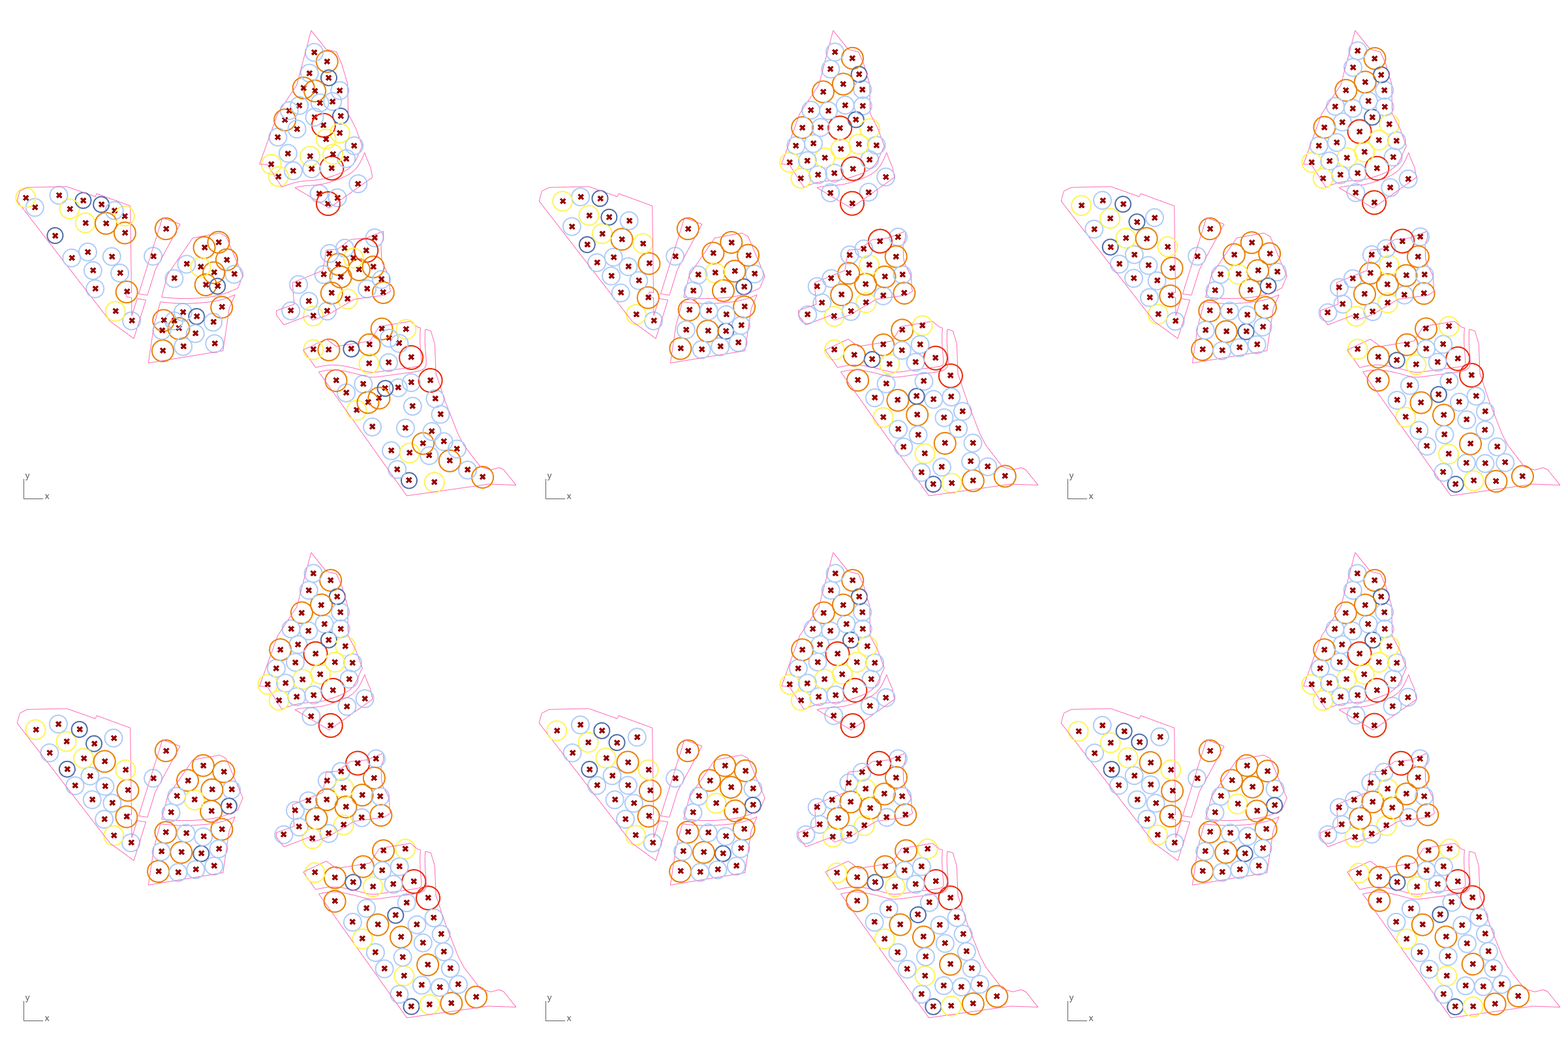
In the center, the minimum space required for each houses (estimation). The different radius sizes come from the different type of houses involved in the project, the larger house (for more people) having more minimum space required. These radius sizes information determines the rest size of the springs for the simulation.
Not shown in the GIFs, the architects could ask for house proportions either for the complete project or per individual lands. Instead of proportions, actual house count is also an option, which is the case in the above GIFs : some lands are intentionally more dense than others. And the last main control is that the architects can decide which house is present in which land, allowing for groupement of houses intended to have children, for example.
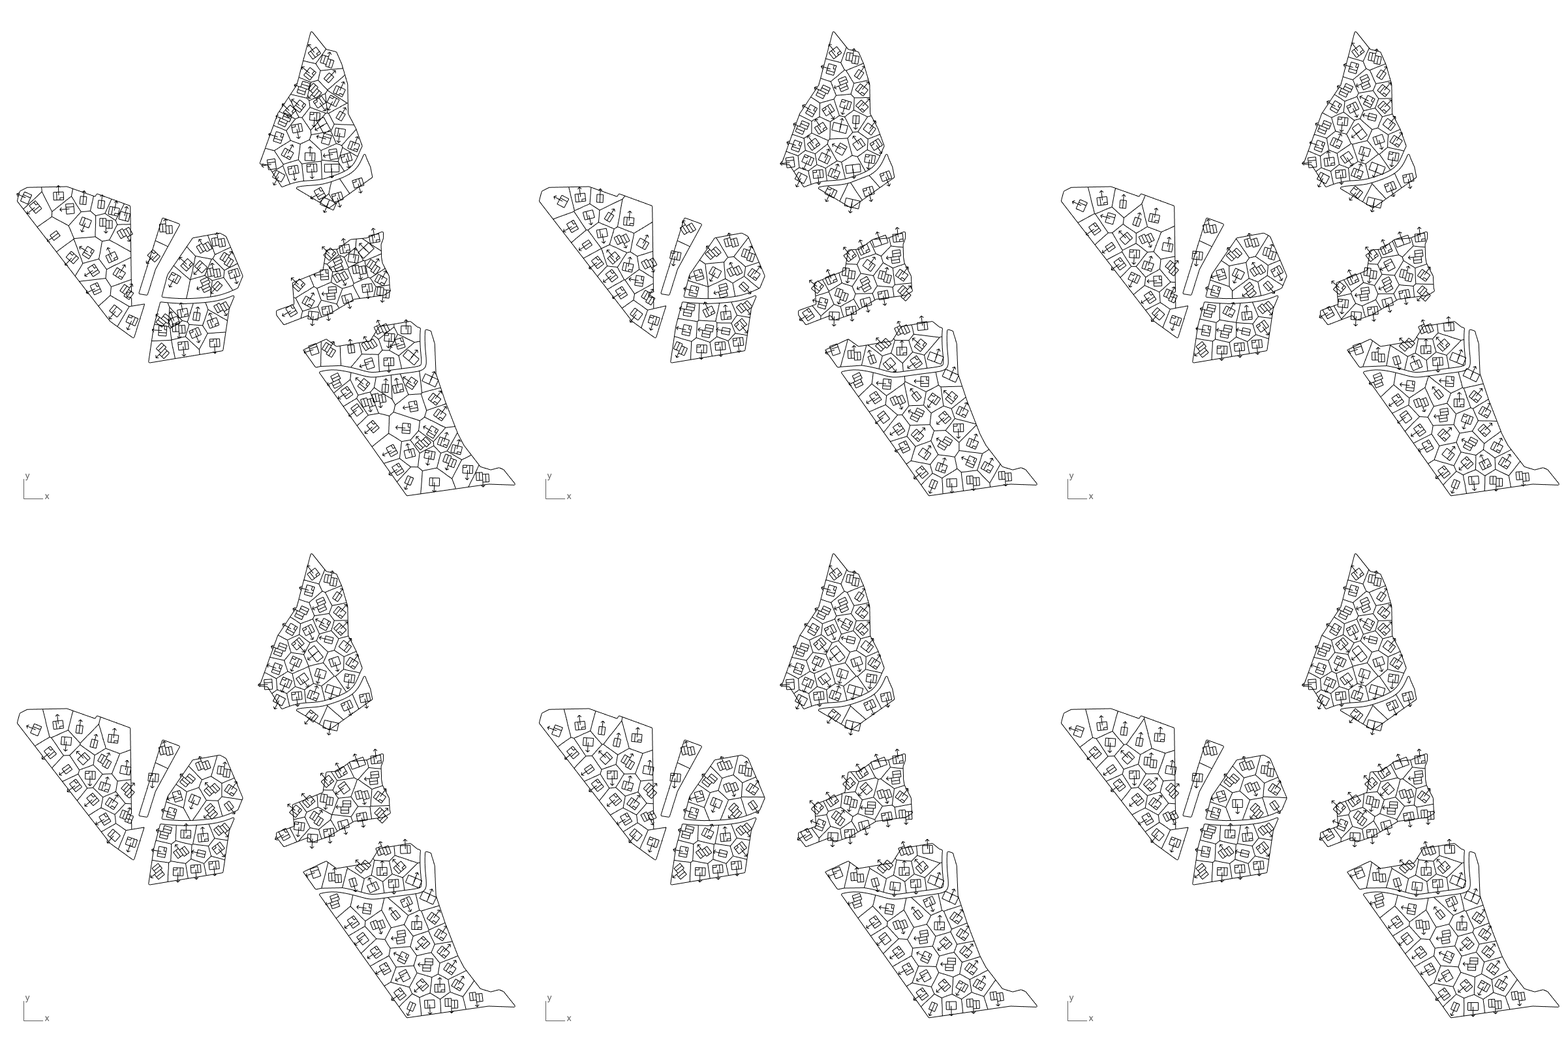
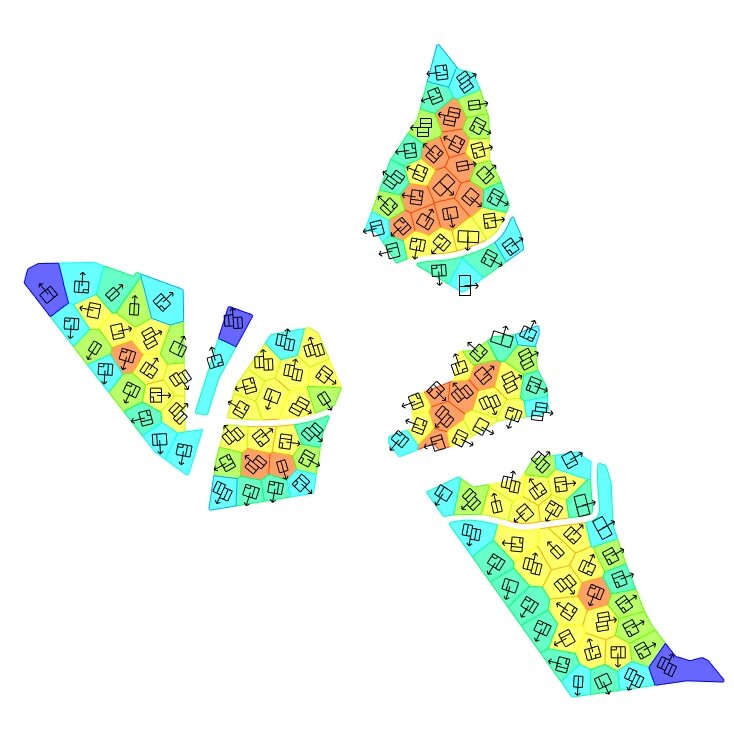
Finally on the right, a pre-result of the simulation (almost in real time). A simple 3D model of the house (depending of the type) is displayed, and a weighted voronoi to estimate the actual surrounding space each house has.
Orientations
When it comes to the computation of the orientation, on the earlier right-handed GIF, the estimation was only accounting for the proximity of surrounding neighbors (in a relatively simple way). A further study went into finding a more accurate (or a “closer to human choice”) way to determine the best available orientation.
A few ways were explored, and due to the relief of the site (surrounding hills), a vector (accounting for the furthest view and solar gains) was set to influence the selected “best orientation” (determined by the neighbors).
Please note that these calculations have to be performed on each houses, also accounting for the near by lands and context, without killing the computer. The selected one takes around 10 seconds processing time (for all the houses) and tries to take in consideration the longest/widest view, the neighbors proximity, the context occlusion (close and far), relief and solar orientation (for each).
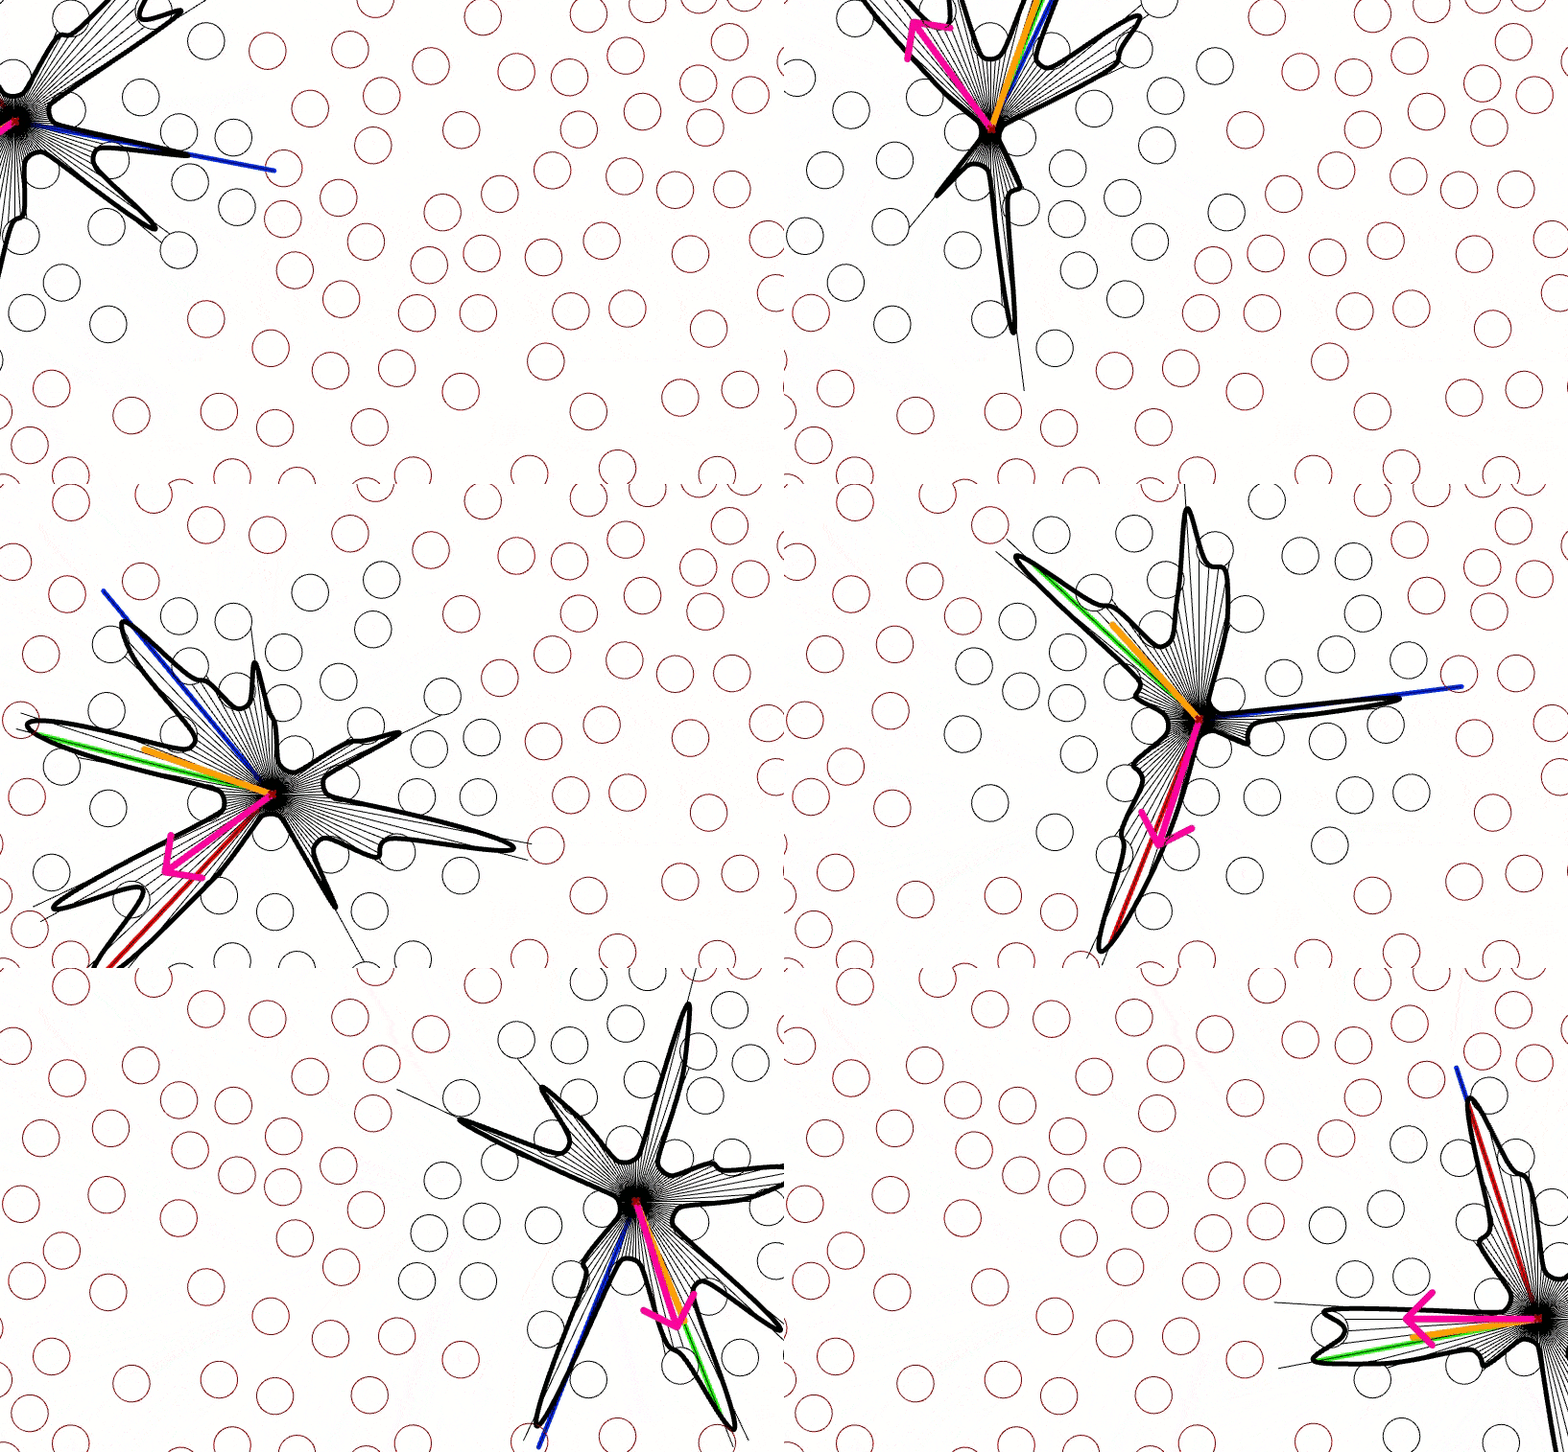
Explorations on “how to select the best orientation” for the houses. Each color is a different algorithm, computed here for one position in time.
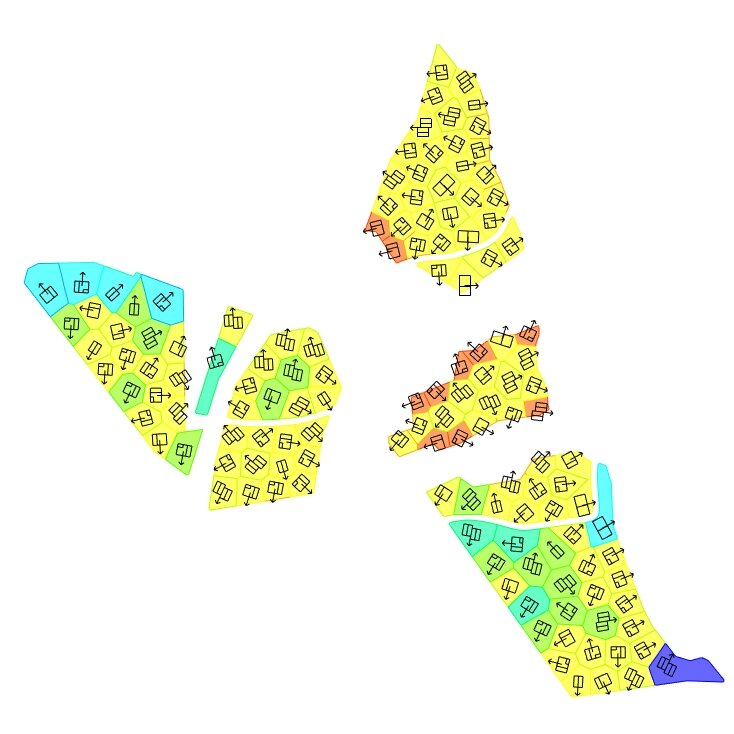
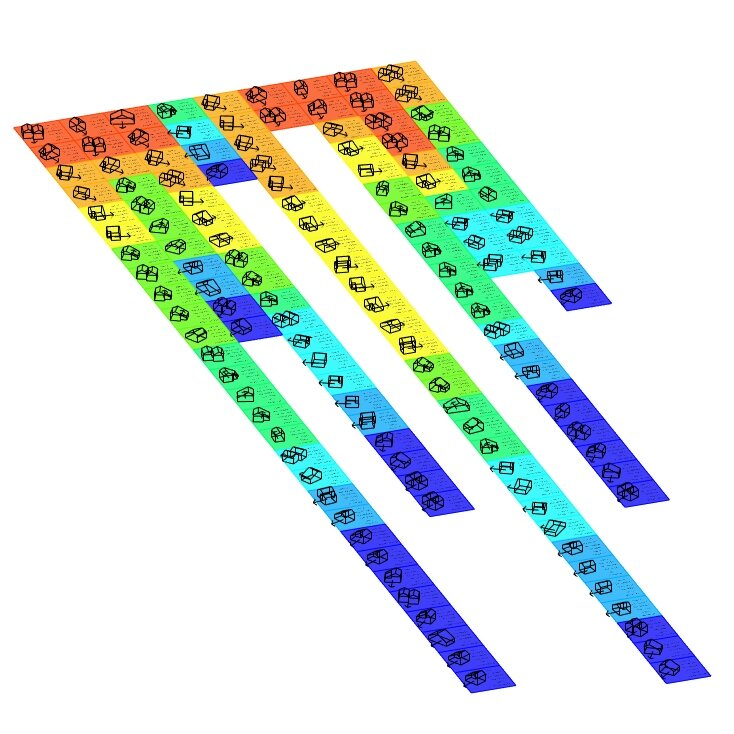
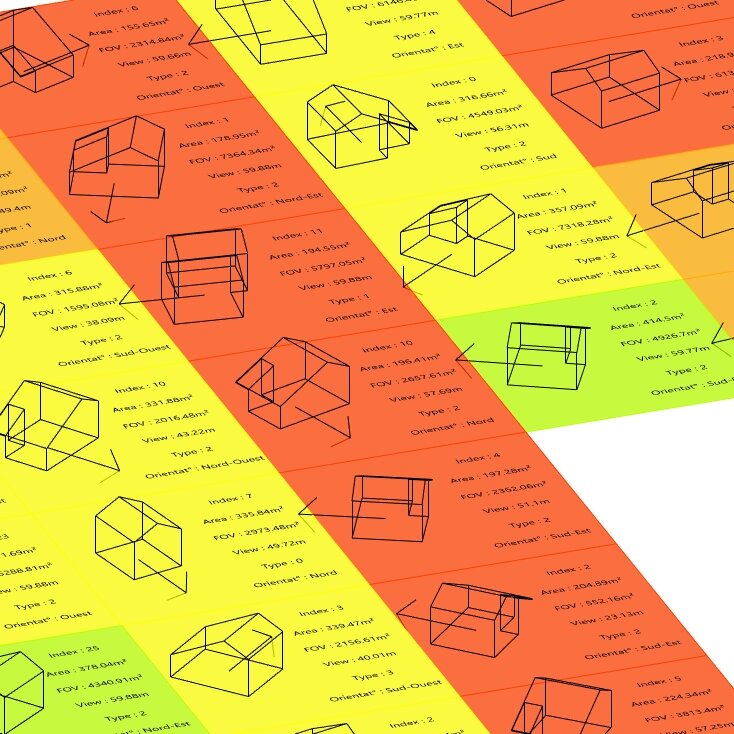
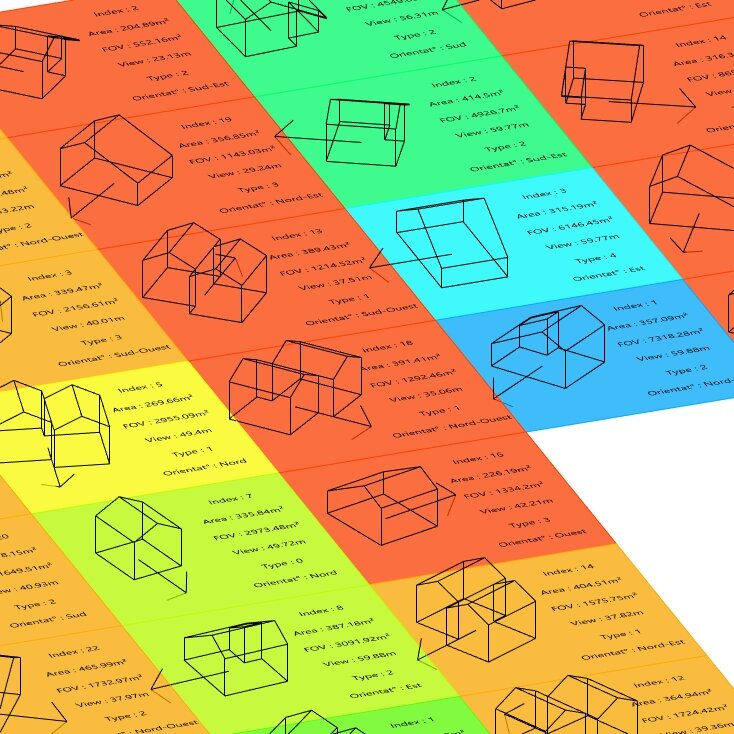
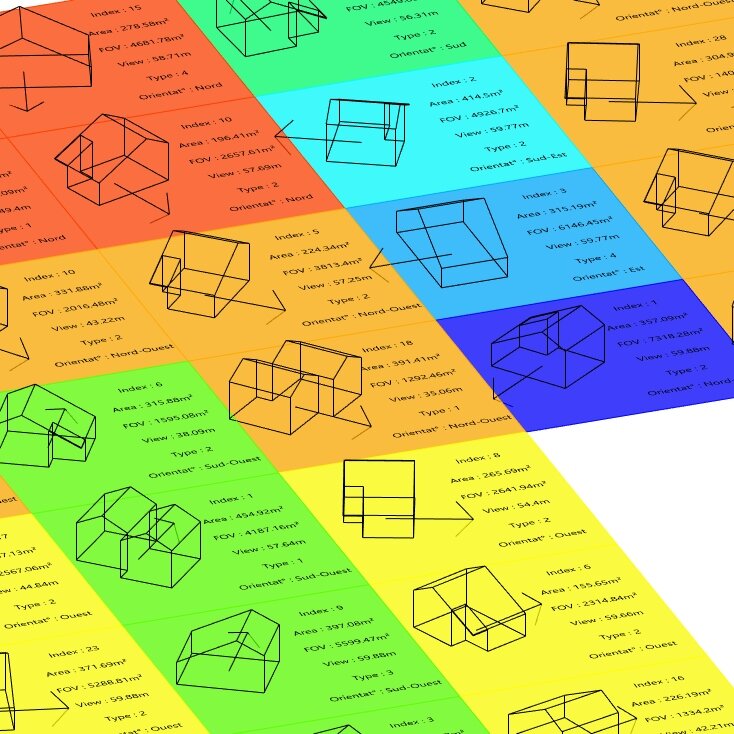
One of the benefits of a parametric approach is that we could retrieve all the information used for the positioning, into a ranking system. The ranking attribute could be anything between view quality, max view distance, 360° view, cardinal orientation, theoretical land space, … and more could be added for other projects. Therefore, prices estimations for each houses and overall investment returns could be made.
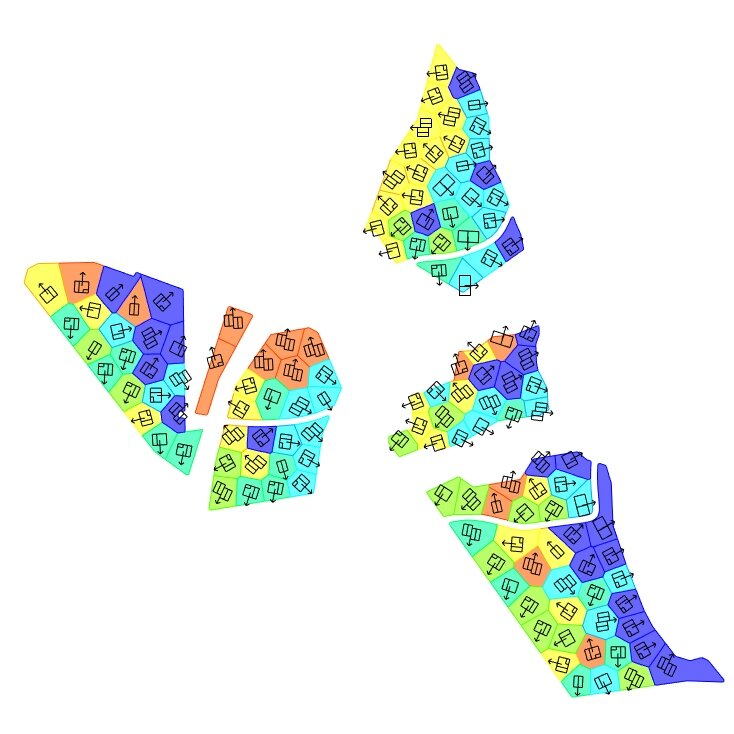
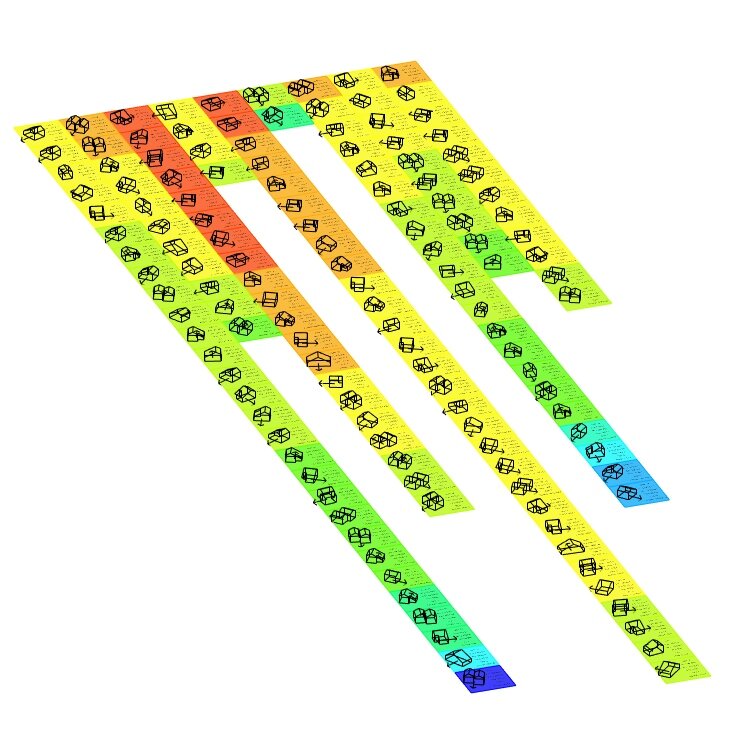
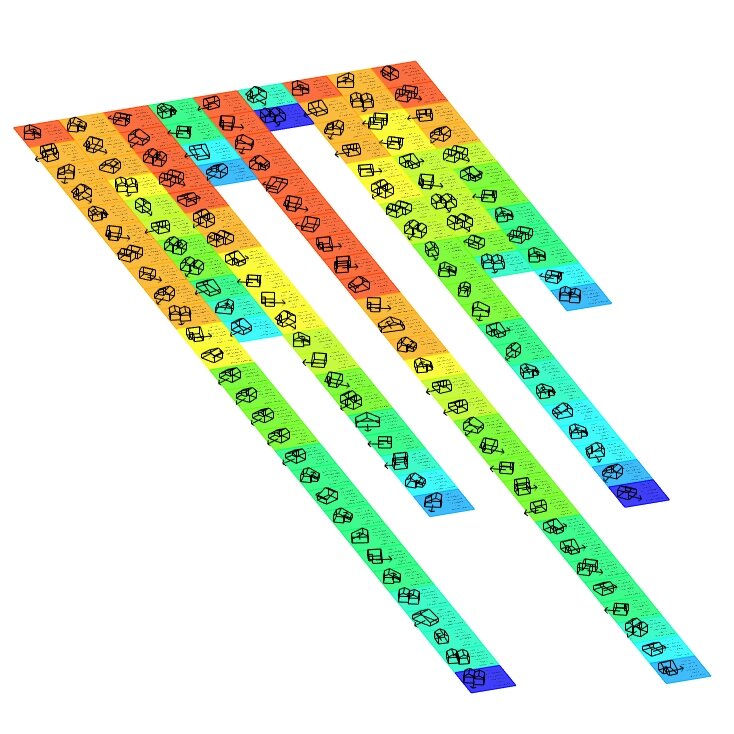
These rankings were available every time a new simulation was made. If the architects were to change the house type proportions per land, add new house models, modify the limits of the terrain or simply change some initial seed states, all the rankings were available and displayable as seen here under.
From left to right : Area, 360° view, main orientation.
From top to bottom : plan view, table view (rankings), zoom on table view.
Here under, a small bonus for presentation purposes allowing to switch between plan and table view smoothly. If the ranking is changed either in plan view or in table view, the positions on the table change, and the translations as well.
This allows also the simulation to be run and only displaying the rankings, without even looking the plan view… if that was not a bad suggestion.
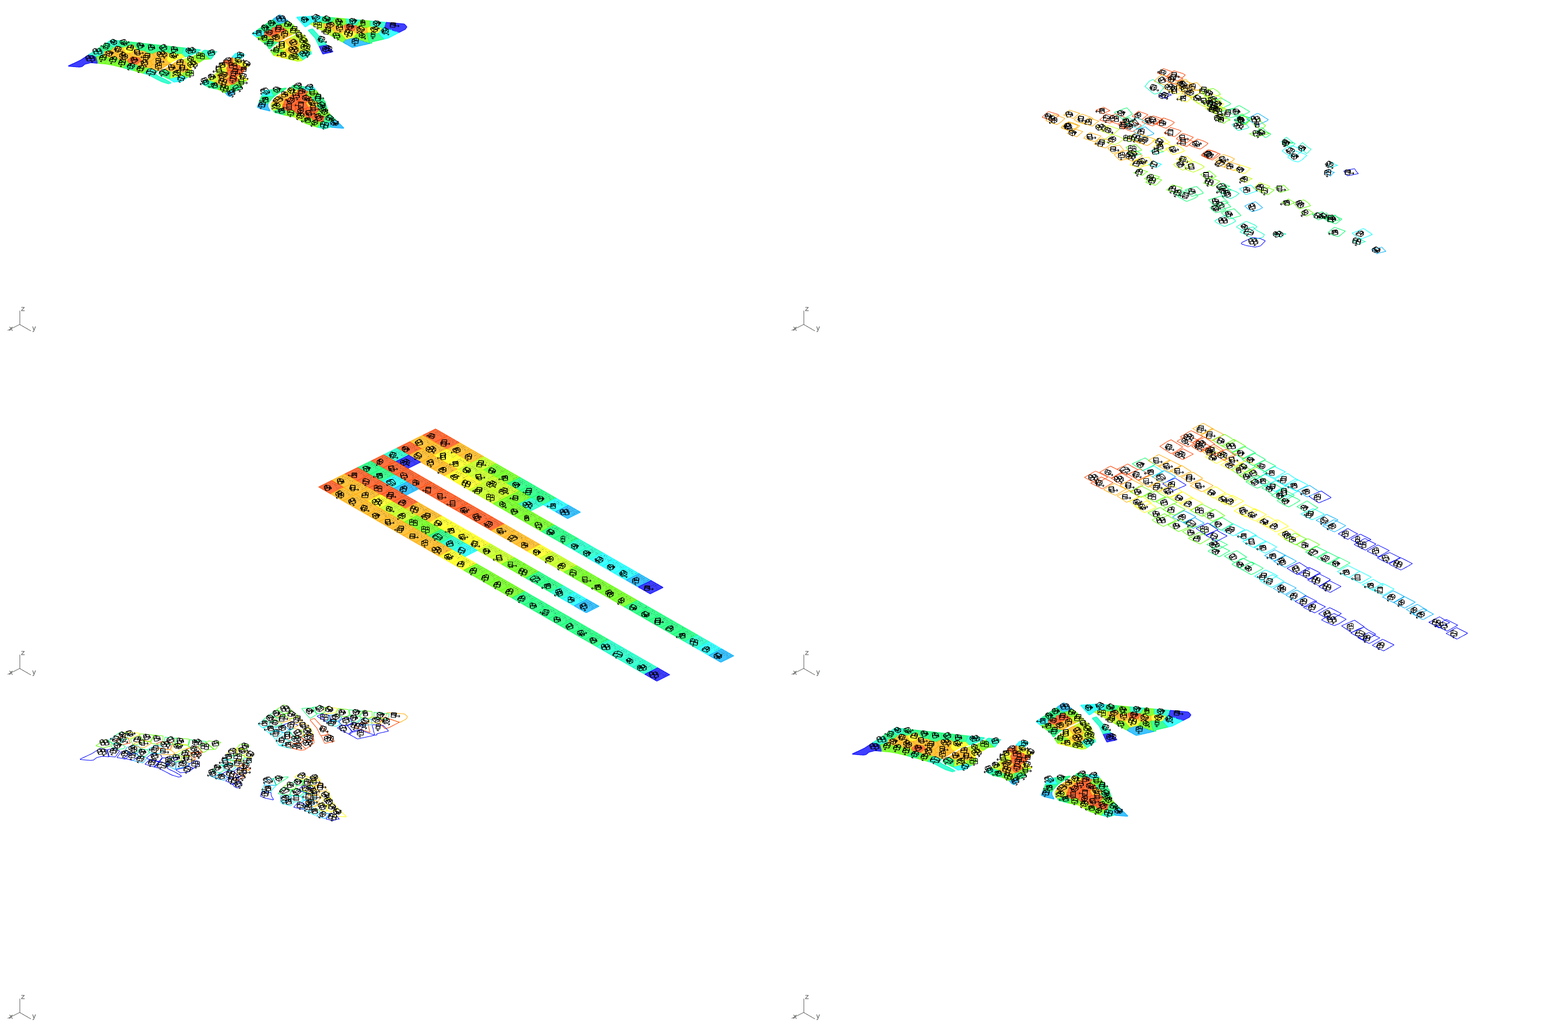
Transition for presentation purposes. Note that the ranking (sorting) data can be changed either from the plan view or the table view, in real time.
If this work has started silently and secretly, it quickly became of great help for the architects. It allowed them to explore different possibilities that would never been tested manually and build up confidence to the clients by showing them that the selected design was optimized and worth investing.

Antoine -
